Features
Part of Costing to price, a step-by-step guide for cut flower enterprises
How to think about flower farm pricing turnaround
Flower farm pricing case study showing how a fictional grower corrected hidden labor, inflated sales volume, channel costs, discounts, overhead, and cash timing.
What to take away
- The fictional farm priced bunches from seed and supply costs while excluding most labor.
- Invoices showed that only 72 percent of marketable bunches were sold.
- Separate wholesale and farmers market statements exposed different selling costs.
- A standing-order price was tied to lower waste and route work, not an arbitrary discount.
- Monthly cash flow and enterprise profit became separate reports.
This fictional case uses illustrative amounts. It shows a costing process, not a recommended flower price.
The starting price
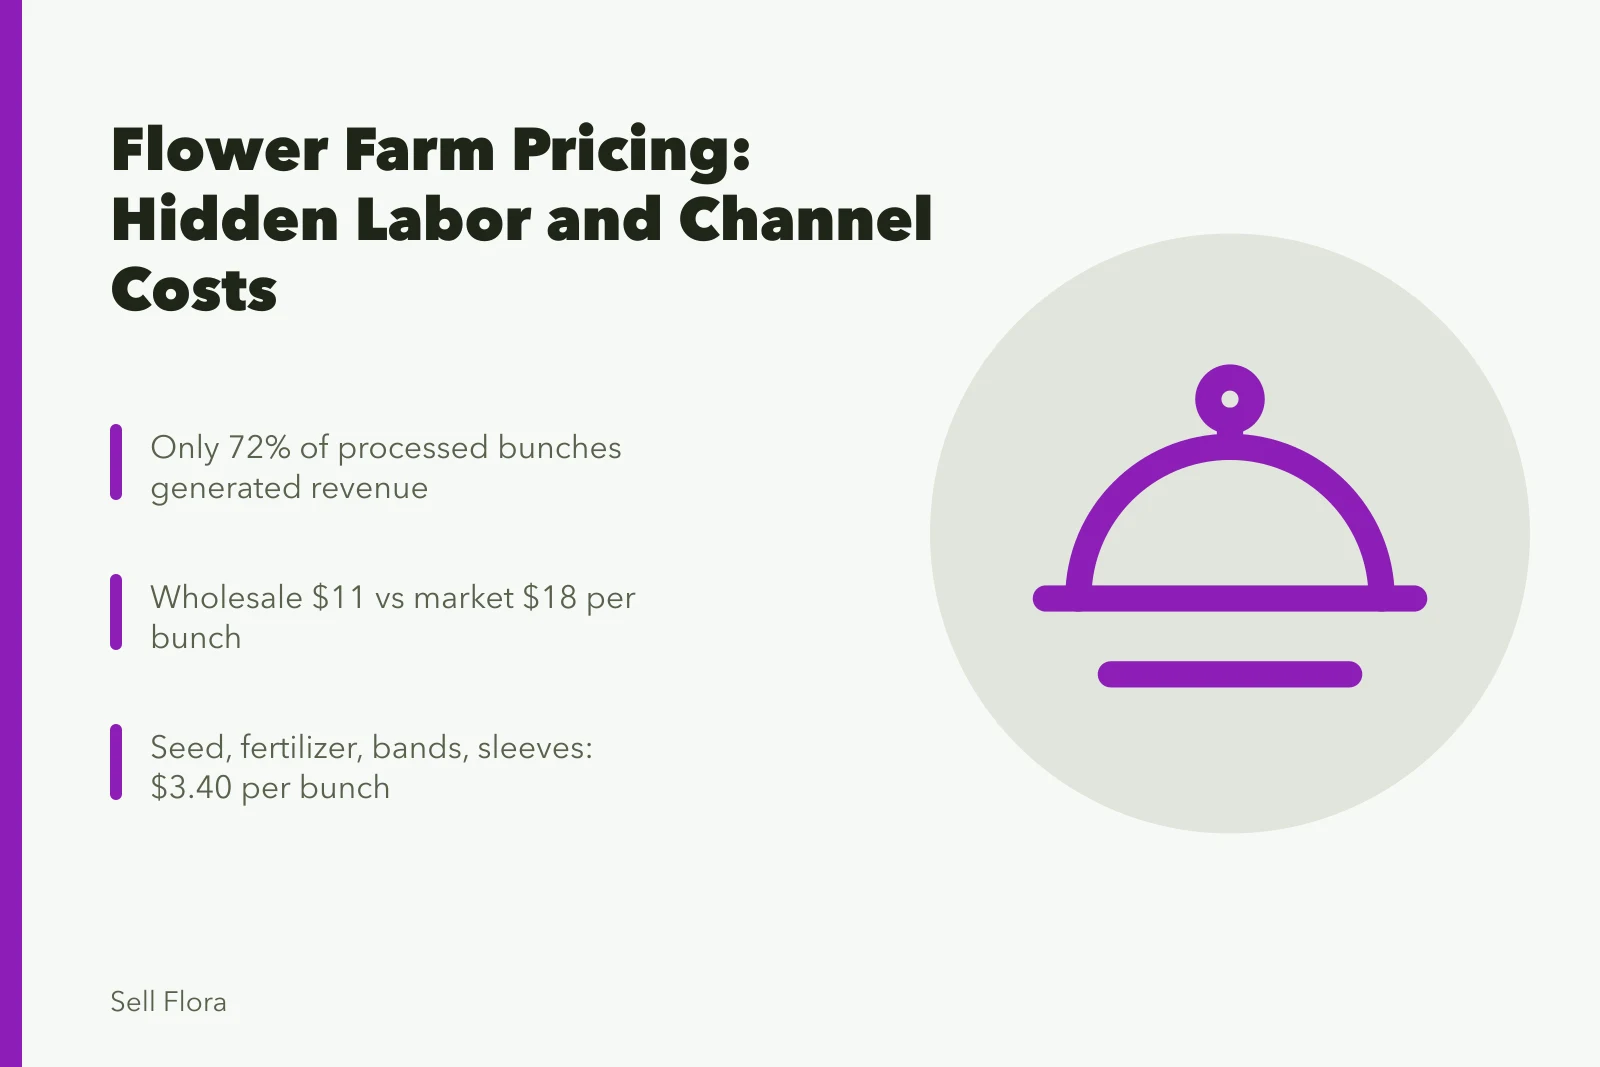
Meadow Row Flowers sold snapdragon bunches for $11 wholesale and $18 at market. The owner believed wholesale was profitable because seed, fertilizer, bands, and sleeves totaled about $3.40 per bunch. She did not include propagation, planting, support, scouting, harvest, grading, delivery, cooler, or administration.
The farm also divided costs by all marketable bunches, even when product was donated or left unsold.
Rebuild the enterprise unit
Meadow Row defined one field snapdragon enterprise and one ten-stem bunch. It traced the season from seed order through bed cleanup, then separated production work from selling work.
| Annual result | Bunches |
|---|
Where the bunches went
- marketable bunches processed1,200
- sold wholesale610
- sold at market254
- donated, credited, or unsold336
- total sold864
Only 72 percent of processed bunches generated revenue. Dividing production cost by 1,200 understated the cost carried by each sale.
Time the labor
Labor tasks coded for four weeks
- Propagation, planting, netting, weeding
- Scouting, cutting, grading, bunching
- Loading, driving, market setup, sales
- Cleanup
- Owner time at stated hourly value
A Utah State University field snapdragon budget provides a concrete example of production, harvest, processing, yield, quality, and sales assumptions. Meadow Row did not copy Utah costs or yields. It used the publication as a prompt to check which categories its own worksheet had omitted.
The largest surprise was not field labor. Saturday market setup, selling, teardown, and unsold processing consumed more hours per bunch than wholesale delivery.
Separate channel statements
Production cost was assigned to every bunch sold. Then each channel received its own selling costs.
| Channel item | Wholesale | Farmers market |
|---|
Wholesale vs farmers market
Wholesale
- Bunches sold
- 610
- Realized price
- $11.00
- Route or market fee
- moderate route cost
- Selling labor
- low per bunch
- Unsold allocation
- lower with preorders
Farmers market
- Bunches sold
- 254
- Realized price
- $18.00
- Route or market fee
- high booth and travel
- Selling labor
- high per bunch
- Unsold allocation
- higher, weather dependent
The $18 market price produced more revenue per bunch, but not automatically more contribution per selling hour. Wholesale performed better on full route days and worse on small emergency deliveries.
Build the new price floor
The farm totaled variable production cost, paid and owner labor, channel expense, and allocated cooler, equipment, insurance, and administration. It calculated cost per sold bunch under weak, expected, and strong sales scenarios.
The old $11 wholesale price did not cover the expected full cost. The farm raised its base price, set a delivery minimum, and created a lower standing-order price only for fixed weekly quantities on the regular route. The concession was smaller than the saved sales time and reduced unsold loss.
Test crop and channel decisions together
Meadow Row used its records to reduce two cultivars with high culls and low florist demand. It shifted a smaller share of stems to market and accepted preorders before building extra bouquets.
Penn State built its Agricultural Alternatives series as dozens of enterprise-level publications, and Cornell's Small Farms Program describes the series as a way to evaluate each enterprise on its own costs and resource needs. That framing reinforced Meadow Row's decision to measure crop and product economics rather than farm revenue alone.
Repair cash timing
Even after prices improved, spring cash remained tight because stock and payroll preceded sales. The owner added a monthly cash-flow projection, separated from the annual profit budget. Subscription deposits and wholesale payment terms were reviewed with professional advice.
She stopped treating a positive annual projection as proof that cash would be available each month.
Results after one season
The farm sold fewer snapdragon bunches at market but reduced unsold product. Average realized wholesale price rose, route minimums reduced small deliveries, and owner labor appeared as a cost. Some account volume fell, but total contribution improved.
The important change was not a single new price. Meadow Row could now explain how units sold, labor, channel terms, and crop quality created it.
Common questions
Why divide by sold bunches?
Sold units carry the cost of production loss and unsold marketable inventory. Keeping those losses separate also shows where correction is possible.
Was the standing-order discount unfair to other buyers?
It reflected different terms that reduced farm cost and uncertainty. The policy was written and available to customers meeting the same conditions.
Did higher prices solve the cash-flow gap?
They helped margin, but timing still required a cash-flow plan. Profitability and monthly liquidity answer different questions.
Why retain owner labor as a cost?
Without it, the farm could not tell whether the enterprise paid for the work or depended on unpaid time.