Rules
Part of Costing to price, a step-by-step guide for cut flower enterprises
Does a full-price cut flower harvest still guarantee a profit?
Cut flower pricing problems diagnosed across missing labor, inflated yield, unsold stems, overhead, channel costs, discounts, margins, and cash flow.
What to take away
- A low calculated cost often means labor, loss, or overhead is missing.
- A price can exceed break-even and still create a cash shortage at the wrong time.
- Discounts should be funded by documented savings or strategic value.
- Compare identical product units and services before using competitor prices.
- Recalculate with actual units sold and realized price after each crop closes.
Pricing failures rarely come from one formula. They come from weak inputs, mixed units, hidden channel work, or a decision that ignores demand. Use the symptom sections below to locate the missing evidence.
The calculated cost looks much lower than expected
Possible causes: owner labor is zero, harvested stems replace sold stems, overhead is omitted, reusable materials are treated as free, delivery is outside the budget, or the enterprise period is incomplete.
Cost Calculation Check
- Trace production tasks from ordering to cleanup
- Trace selling tasks through payment collection
- Reconcile sold units with invoices
- Reconcile sold units with outlet tallies
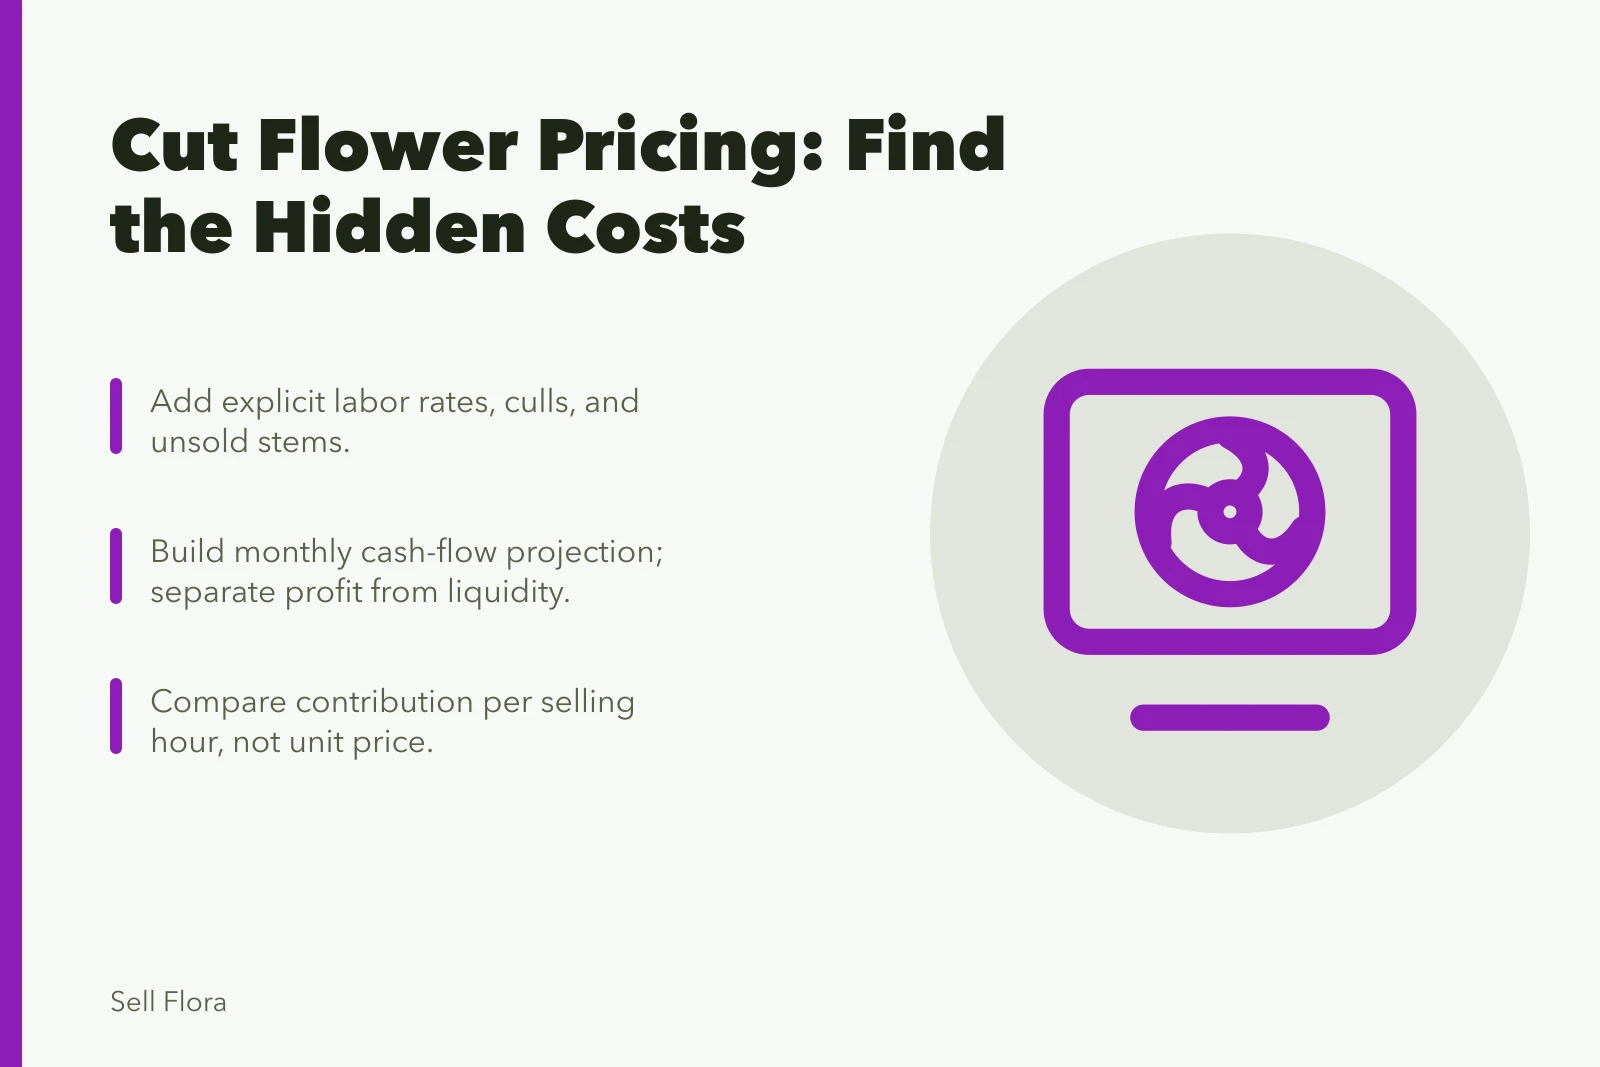
- Add explicit labor rates and culls
- Add unsold loss and channel cost
- Add depreciation and end-of-crop work
Check: trace each production task from ordering through cleanup and each selling task through payment collection. Reconcile total sold units with invoices and outlet tallies.
Correction: add explicit labor rates, culls, unsold loss, channel cost, depreciation or ownership allocation, and end-of-crop work. Preserve the old calculation so the difference is visible.
The farm sells a lot but cash remains tight
Possible causes: customers pay after input bills are due, debt principal is not shown as an expense on the income statement, owner draws exceed the plan, inventory ties up cash, or a profitable annual enterprise has a seasonal cash gap.
Cash Flow Projection Steps
- Build monthly cash-flow projection
- Compare actual inflows and outflows
- Separate profitability from liquidity
- Adjust deposits and payment terms
- Adjust order timing and borrowing
- Adjust owner draws and purchase dates
- Adjust enterprise mix with advice
Check: build a monthly cash-flow projection and compare actual inflows and outflows. Separate profitability from liquidity.
Correction: adjust deposits, payment terms, order timing, borrowing, owner draws, purchase dates, or enterprise mix with qualified financial advice. Do not raise prices without first identifying whether margin or timing is the issue.
A high-yield crop loses money
Possible causes: wide bed occupation, frequent harvest, slow processing, low sale price, heavy culls, delivery burden, or too much unsold volume.
High-Yield Crop Profit Check
- Calculate marketable sold units per bed week
- Calculate contribution after variable cost per labor hour
- Break culls into field, processing, postharvest
- Break culls into rejection and unsold categories
- Use realized saleable volume, not biological maximum
Check: calculate marketable sold units per bed week and contribution after variable cost per labor hour. Break culls into field, processing, postharvest, rejection, and unsold categories.
Penn State Extension's guide to budgeting for agricultural decisions explains that enterprise budgets should use operation-specific receipts and costs, distinguish variable from fixed costs, and calculate break-even price from total cost and expected yield. Use the farm's realized saleable volume rather than a biological maximum.
Wholesale appears less profitable than retail
Possible causes: the comparison uses wholesale bunch revenue against retail bouquet revenue without subtracting design, booth, selling, card, transport, and unsold costs.
Check: create one channel statement per outlet with product units, realized sales, all cash costs, labor, miles, loss, and allocated equipment.
Correction: compare contribution per selling hour and per production unit. A lower wholesale unit price may still perform well when orders are large, repeatable, and quick to fulfill.
A discount increases sales but reduces total contribution
Possible causes: the price cut exceeds fulfillment savings, current margin is thin, extra volume triggers overtime or a new route, or discounted buyers replace full-price demand.
Check: calculate contribution per unit before and after the discount, then multiply by realistic units. Add capacity-step costs.
Correction: tie discounts to prepaid standing orders, minimum volume, fixed pickup, limited grades, or other terms that reduce farm cost. Set an end date and review result.
Margin and markup do not match
Possible cause: a percentage was added to cost but described as the same percentage of selling price.
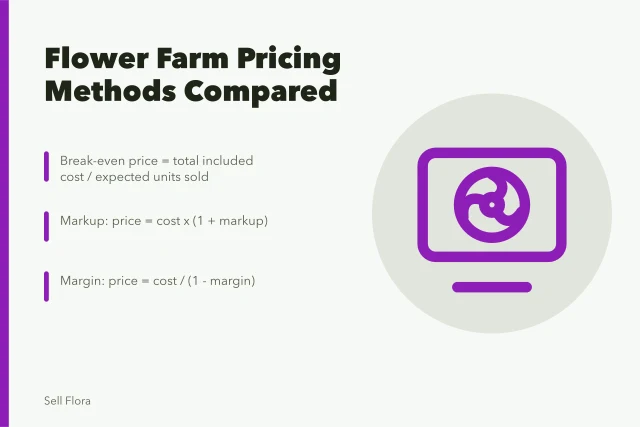
Check: for a $10 cost with a 25 percent markup, price is $12.50 and margin is 20 percent. For a 25 percent margin, price is $10 / 0.75, or $13.33.
Correction: name the measure in every worksheet and display the formula beside the input.
Competitor pricing creates losses
Possible causes: the competitor has different scale, quality, service, labor treatment, overhead, or channel, or the compared unit is not equivalent.
Check: match crop, grade, stem count, length, maturity, week, location, channel, delivery, order minimum, and terms. Iowa State's pricing guide says production and marketing cost provides a minimum price reference while competitors and customer value provide context.
Correction: use competitor data to test positioning, not to replace farm cost. Change product, process, channel, or crop when the market cannot support a viable offer.
One overhead percentage distorts crops
Possible causes: cooler-heavy crops, structure-heavy crops, and direct-market products use farm assets differently.
Check: identify major overhead pools and their drivers. Test whether revenue percentage, labor hours, bed weeks, bucket days, miles, or square-foot months better reflects use.
Correction: adopt a documented method and review it annually. Do not chase perfect allocation when a practical consistent driver answers the decision.
The price works on paper but buyers decline
Possible causes: the specification is weak, timing is wrong, bunch unit is inconvenient, quality is inconsistent, substitutes are cheaper, or the farm assumed value without testing it.
Check: ask buyers why, compare actual alternatives, and offer controlled samples or quotes. Separate objections about product, service, unit, timing, and price.
Correction: improve the offer, change channel, reduce cost, or discontinue it. Do not promise volume while testing demand.
Common questions
Can a crop with negative total profit be kept temporarily?
Sometimes a short-run decision may cover variable cost while the farm restructures, but set a deadline and understand that long-run viability requires fixed costs and replacement needs.
Should donated flowers count as sales?
No. Record them separately with their purpose and applicable accounting treatment. They still consume production and handling resources.
Why calculate contribution per labor hour?
Labor is often the binding resource during harvest. A crop with good bed returns may block more profitable work if it is slow to cut and process.
When is a lower price sensible?
When it increases total contribution, reduces loss, secures useful commitments, or serves a defined strategy whose cost and duration are measured.