Features
Part of Choosing a cut flower sales channel strategy that fits farm capacity
Cut flower channel mix case study: fictional farm redesign
Cut flower channel mix case study of a fictional farm's redesign, using labor, waste, route, payment, and contribution records to assess sales outlets.
What to take away
- The fictional farm mistook retail price for channel profit.
- Four weeks of time, mileage, waste, credit, and sales records changed the ranking.
- A florist route worked when delivery density and standing orders improved.
- Fewer market dates reduced leftovers and protected production labor.
- The final mix assigned each channel a defined product and capacity limit.
This cut flower channel mix case study uses an explicitly fictional farm and illustrative figures. It demonstrates a decision method, not typical flower-farm results or recommended prices.
The starting mix
North Fork Flowers sold at two Saturday markets, delivered to six florists when they ordered, and offered porch pickup by message. The owner believed the first market was strongest because bouquets sold for $24 there, compared with $13 for wholesale bunches.
The farm recorded total sales but not sales labor, delivery time, leftovers, credits, or channel-specific packaging. Wednesday florist deliveries often interrupted harvest. Porch orders were accepted until the last minute, and the same flowers appeared on three lists.
The four-week measurement period
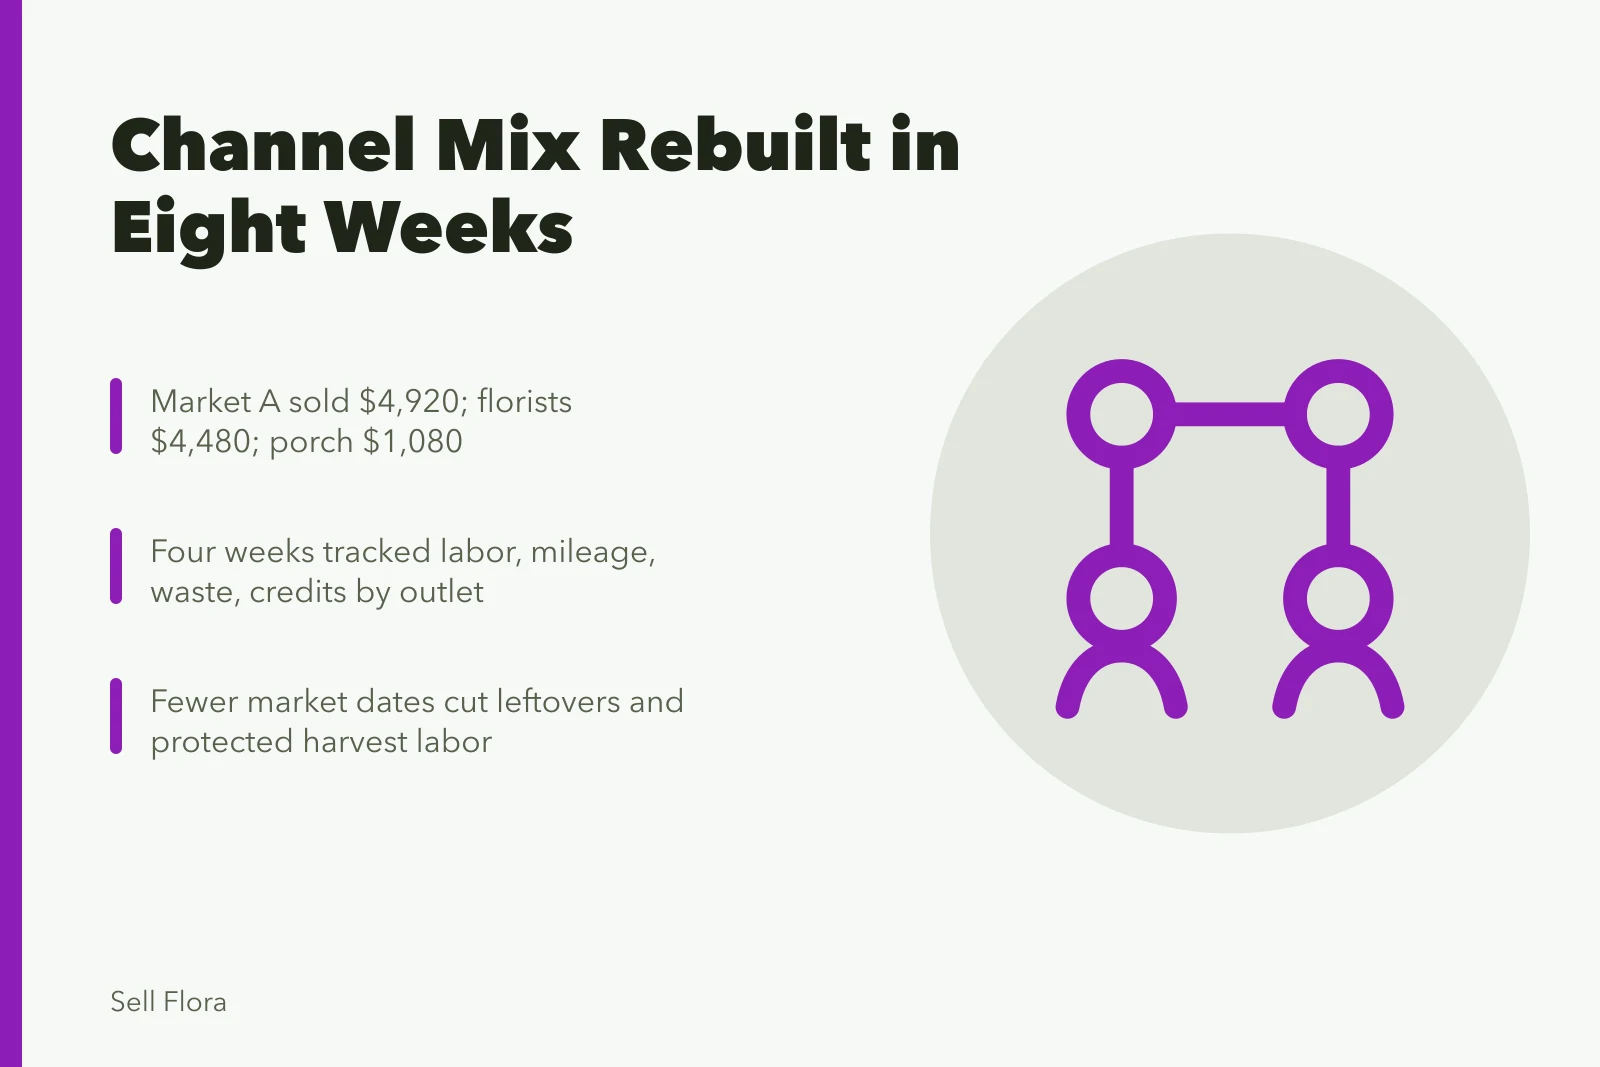
North Fork assigned every sale to an outlet and used work codes for harvest, processing, design, order administration, loading, driving, setup, selling, and cleanup. It counted opening and closing market stock and connected credits to the original invoice.
Channel metrics over four weeks
Market A
- Selling days or cycles
- 4
- Gross revenue
- $4,920
- Channel labor hours
- 76
- Fees, travel, packing
- $890
- Unsold or credited product
- $570
Market B
- Selling days or cycles
- 4
- Gross revenue
- $3,140
- Channel labor hours
- 70
- Fees, travel, packing
- $820
- Unsold or credited product
- $690
Florists
- Selling days or cycles
- 8
- Gross revenue
- $4,480
- Channel labor hours
- 34
- Fees, travel, packing
- $610
- Unsold or credited product
- $190
Porch pickup
- Selling days or cycles
- 12
- Gross revenue
- $1,080
- Channel labor hours
- 19
- Fees, travel, packing
- $120
- Unsold or credited product
- $95
Market A
- selling days or route cycles
- 4
- gross revenue
- $4,920
- channel labor hours
- 76
- fees, travel, and packing
- $890
- unsold or credited product at production cost
- $570
Market B
- selling days or route cycles
- 4
- gross revenue
- $3,140
- channel labor hours
- 70
- fees, travel, and packing
- $820
- unsold or credited product at production cost
- $690
Florists
- selling days or route cycles
- 8
- gross revenue
- $4,480
- channel labor hours
- 34
- fees, travel, and packing
- $610
- unsold or credited product at production cost
- $190
Porch pickup
- selling days or route cycles
- 12 pickup windows
- gross revenue
- $1,080
- channel labor hours
- 19
- fees, travel, and packing
- $120
- unsold or credited product at production cost
- $95
These figures excluded production cost of sold flowers, which was then assigned by the crop and unit records.
Compare the channels consistently
The farm calculated contribution after the production cost of sold units and every channel-specific cost. It then divided that amount by channel labor hours. The precise result matters less than using the same boundary for every outlet.
Contribution per channel hour
Market A
- Contribution rank
- Profitable
- Per-hour result
- Below expected
- Leftovers relative to sales
- Moderate
- Labor pattern
- Saturday
Market B
- Contribution rank
- Weakest
- Per-hour result
- Weakest
- Leftovers relative to sales
- Most
- Labor pattern
- Saturday
Florists
- Contribution rank
- Second
- Per-hour result
- First when full
- Leftovers relative to sales
- Low
- Labor pattern
- Route-dependent
Porch pickup
- Contribution rank
- Positive
- Per-hour result
- Scattered windows
- Leftovers relative to sales
- Low
- Labor pattern
- Many handoffs
The University of Minnesota's FINPACK team recommends market-channel analysis for diversified direct-market farms because revenue is often tracked by outlet rather than crop. Its outline includes revenue, labor, marketing, production, and overhead expenses by market. North Fork used that structure but kept crop profitability as a separate report.
Market A stayed profitable but returned less per hour than the owner expected. Market B had the weakest contribution, the most leftovers relative to sales, and the same Saturday labor Market A needed.
Florists ranked second on total contribution and first per channel hour when the route was full. Porch pickup was positive but used too many scattered handoff windows.
Find the process causes
The records showed four causes:
- Market B traffic did not support the volume packed from peak-harvest intuition.
- Both markets carried too many low-volume bouquet variations, slowing design and checkout.
- Florist deliveries were dispatched for small orders on several days.
- Porch customers chose flexible times that repeatedly interrupted field and family work.
The farm did not conclude that retail or wholesale was inherently superior. It identified how each local system was being run.
Redesign the offer
North Fork kept Market A every week and reduced Market B to two proven seasonal events. It offered three clear bouquet sizes at Market A and opened preorders on Thursday evening. Opening inventory was based on recent sell-through plus confirmed orders.
Redesigned channel operations
Before
- Market A
- Every week
- Market B
- Every week
- Florist delivery
- Several days
- Porch pickup
- Flexible times
- Availability list
- Ad hoc
After
- Market A
- Every week
- Market B
- Two seasonal events
- Florist delivery
- Tuesday route minimum
- Porch pickup
- Two fixed prepaid windows
- Availability list
- Friday list, Sunday close
Florist delivery moved to Tuesday with a route minimum. Three buyers accepted standing quantities for six weeks. The availability list went out Friday, orders closed Sunday, and confirmations went out Monday. Emergency delivery remained possible at a stated fee when capacity allowed.
Porch pickup changed to prepaid orders with two fixed weekly windows. No unconfirmed inventory was held beyond the cutoff.
Allocate flowers before publishing lists
For the redesigned mix, allocate in this practical priority order:
- Prepaid porch-pickup orders.
- Confirmed florist standing quantities.
- Confirmed market preorders.
- A market buffer based on recent sell-through.
Flower allocation priority order
- Prepaid subscriptions and preorders
- Florist standing orders
- Confirmed weekly florist additions
- Market A base load
- Adjustable market buffer
Damaged or short crops triggered early buyer contact. The owner could override allocation only by recording the affected order and reason.
Test the new mix against capacity
North Fork built a weekly calendar for harvest, conditioning, design, list preparation, packing, delivery, market loading, sales, and cleanup. It capped total bouquet orders when Friday design hours filled, even if stems remained available for wholesale bunches.
Weekly capacity calendar
- Harvest
- Conditioning
- Design
- List preparation
- Packing
- Delivery
- Market loading, sales, cleanup
Oregon State University Extension defines profit as gross returns less production and marketing costs and stresses that enterprise budgets must reflect the individual farm's assumptions. Its discussion of fixed, variable, labor, packaging, and marketing costs reinforced the choice to test the redesigned mix with full costs rather than projected revenue alone.
Results after eight weeks
Gross sales fell slightly because Market B operated less often. Contribution increased because market labor, fees, travel, and leftovers fell more than revenue. The florist route became denser, and fixed delivery days reduced harvest interruptions. Porch pickup generated fewer orders but took much less coordination time.
The farm retained a limited Market B presence for two dates with strong past demand. It did not call the channel a failure. It changed its job from weekly outlet to seasonal event.
What the farm kept measuring
North Fork maintained a monthly channel report with:
- gross and net sales;
- channel labor and expense;
- unsold, rejected, and credited product;
- contribution and contribution per channel hour;
- route revenue per mile and stop;
- payment age; and
- service failures.
It reviewed crop profit separately so a strong sales route could not hide a weak crop.
Common questions
Why did the farm keep a lower-volume market?
Specific seasonal dates had good records and served a customer-acquisition role. The farm limited the commitment instead of judging all dates together.
Did the route minimum punish small florists?
No buyer was forced to accept it. The farm offered pickup and a paid exceptional-delivery option, then applied the route rule consistently.
Why track channel and crop profit separately?
A channel can operate well while carrying an unprofitable crop, or a strong crop can be sold through an inefficient outlet. Both views are needed.
Can a farm copy these figures?
No. The amounts are fictional. Use farm-specific prices, labor, waste, mileage, fees, costs, and payment terms.