Features
Part of 6 pointers on cut flower pest that hold up
The honest guide to cut flower ipm turnaround
Cut flower IPM case study showing how a fictional farm replaced calendar sprays with mapped scouting, diagnosis, hot-spot controls, follow-up, and records.
What to take away
- The fictional farm sprayed by calendar but did not know which pests were increasing.
- A mapped route separated thrips movement, aphid hot spots, and noninfectious leaf injury.
- Laboratory diagnosis prevented a fungicide application to a nutritional problem.
- Follow-up counts exposed poor spray reach and protected successful biological control.
- Treatment cost, rejected stems, and scouting trends replaced spray count as performance measures.
This fictional case uses illustrative numbers. It is a workflow example, not a pesticide recommendation or an action threshold for another farm.
The starting problem
North Lane Flowers grew snapdragons, dahlias, lisianthus, and zinnias in two tunnels and six field blocks. Its manager scheduled a broad insecticide every ten days and added fungicide whenever leaves spotted. Product costs rose, yet florists still rejected blooms with thrips damage and aphids.
The application log listed dates and products. It did not record target counts, exact hot spots, beneficial insects, or results. Several workers used "bugs" as the target description.
Create a baseline
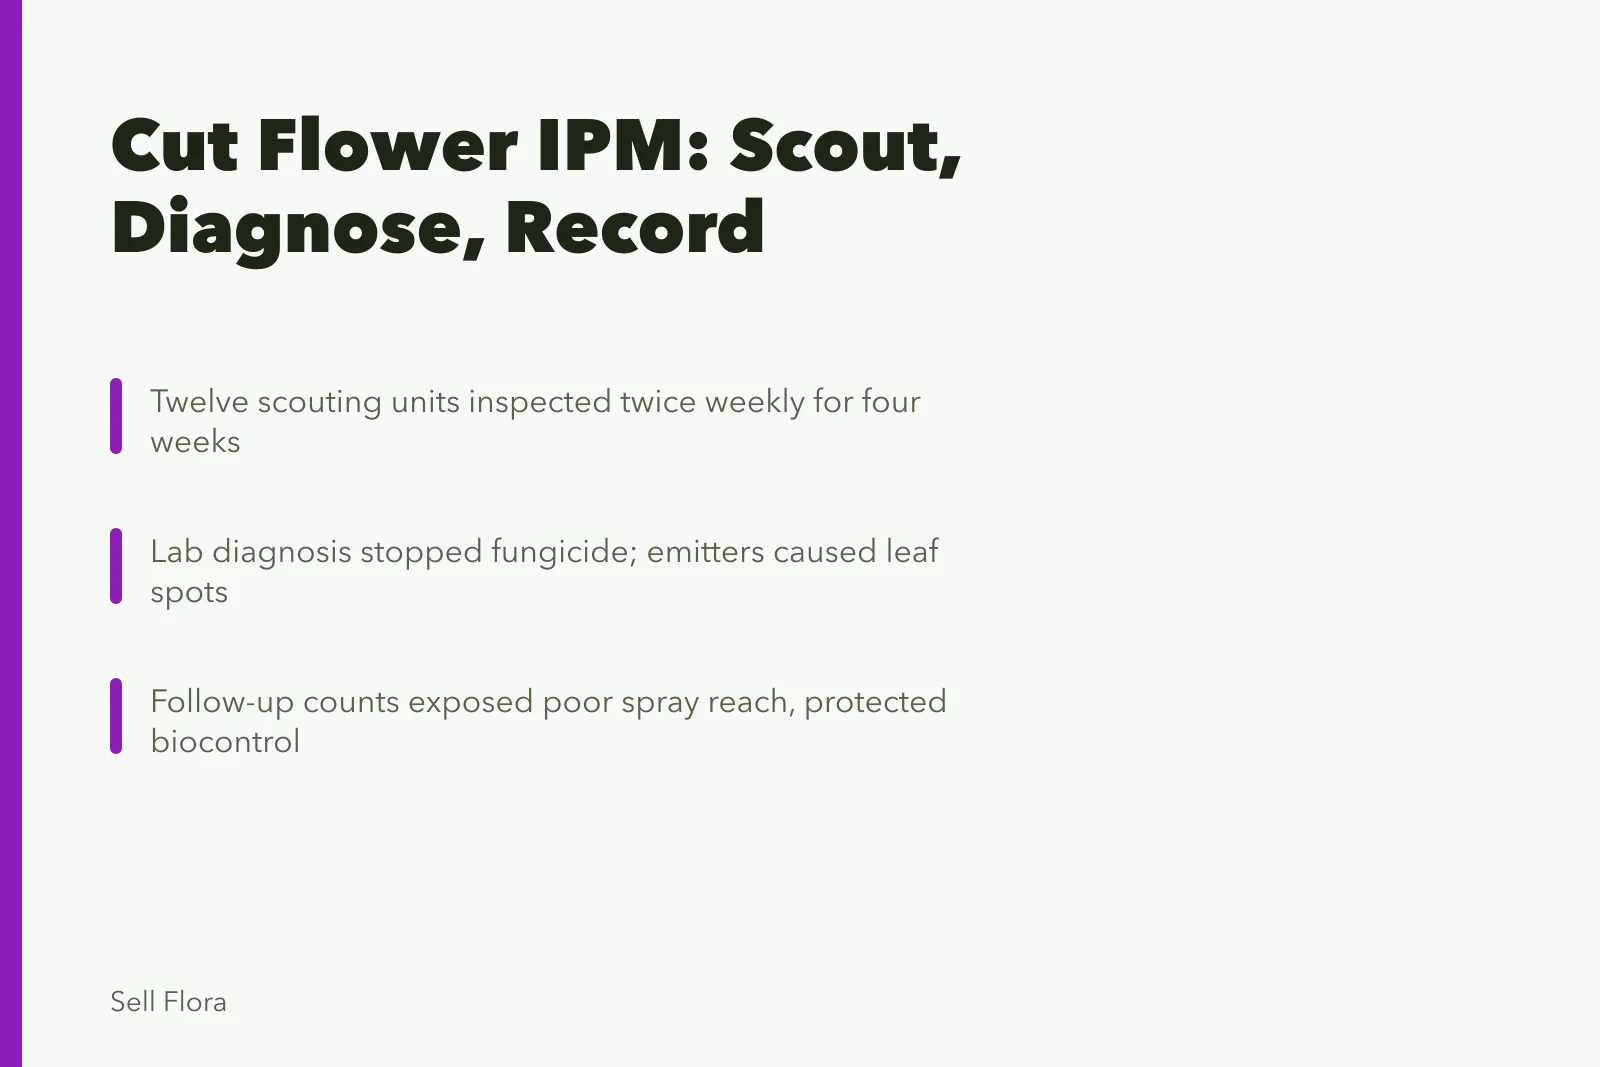
The farm paused nonessential calendar applications and mapped twelve scouting units. A trained scout inspected each unit twice weekly for four weeks. She used direct plant checks, flower taps, fixed sticky-card locations in tunnels, and flags on affected plants.
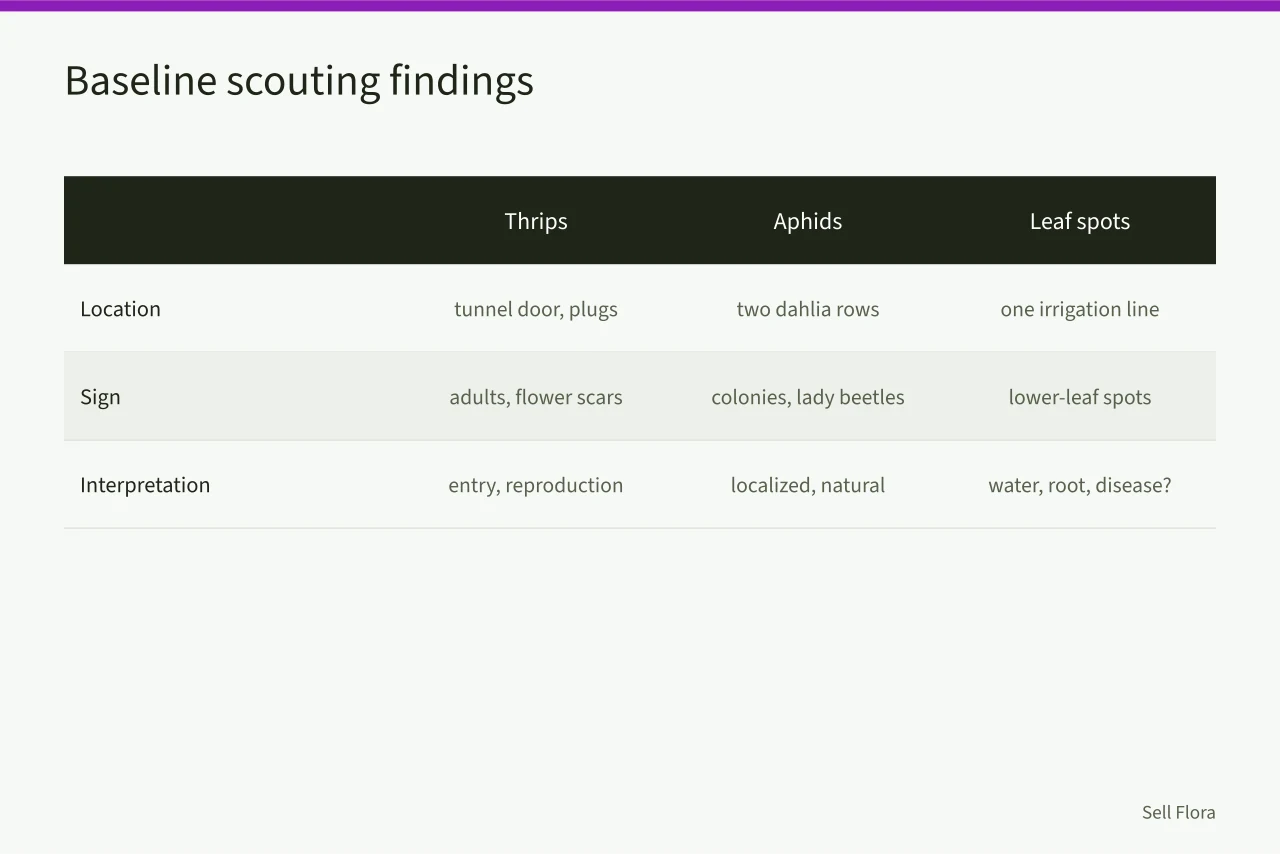
The first baseline showed three different patterns:
| Finding | Pattern | Initial interpretation |
|---|---|---|
| thrips adults and flower scars | concentrated near one tunnel door and incoming plugs | likely entry and established reproduction |
| aphid colonies | two dahlia rows with many lady beetle larvae | localized population with natural enemies |
| lower-leaf spots | one lisianthus irrigation line | possible water, root, nutrition, or disease issue |
The team adopted a single record form. UMass Extension provides adaptable pest monitoring and record-keeping forms and explains that repeat monitoring can show whether pressure increased, decreased, or stayed level after treatment. North Lane kept the same counting units so each week could be compared.
Confirm before treating
The scout sent representative lisianthus plants and irrigation history to a diagnostic laboratory. The result did not support the feared foliar pathogen. Root-zone testing and emitter measurements pointed to uneven water and nutrition along the line.
The farm repaired emitters, flushed under qualified guidance, and watched new growth. It did not apply the planned fungicide. The old spots remained, but new leaves improved.
The thrips identification was confirmed from flowers and traps. Aphids were counted by growing tip, with lady beetle larvae recorded separately.
Change the control sequence
North Lane made five changes:
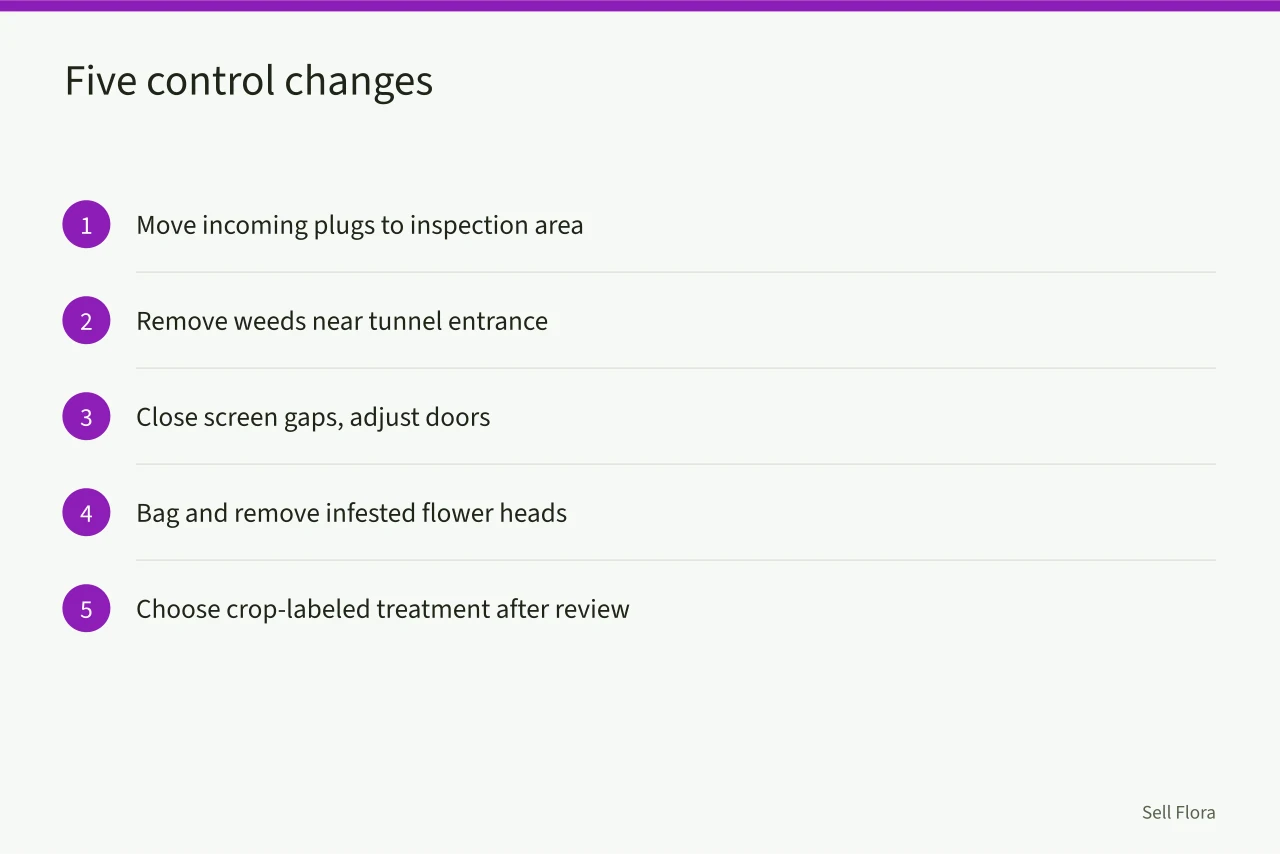
The aphid rows were not blanket-sprayed. The scout marked colonies, preserved the active predators, removed two severely infested tips, and increased checks. Aphid counts fell over the next two inspections.
Find an application failure
Thrips counts declined at the tunnel edge but remained high inside dense snapdragon flowers. Water-sensitive cards and inspection showed that the spray had reached upper leaves but not the protected target area. The manager reviewed application equipment and label directions rather than increasing the rate.
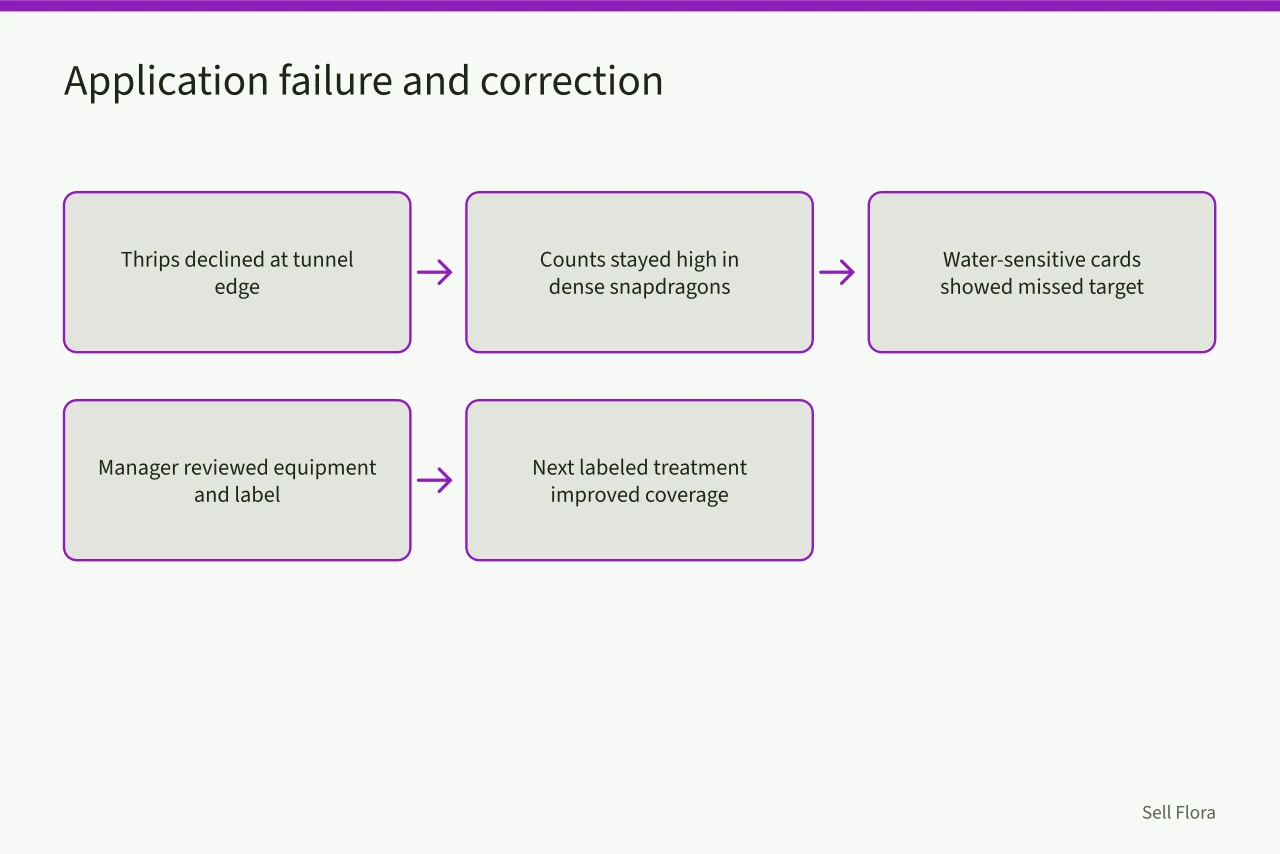
After correction, the next labeled treatment improved coverage. The farm preserved an untreated comparison group outside the sale block where practical and tracked new flower injury.
EPA's resistance guidance explains that repeated exposure can reduce pesticide performance and places resistance management within a broader IPM program. North Lane recorded resistance groups and avoided treating "rotation" as a switch between brand names with the same group.
Redefine success
The old scorecard counted completed applications. The new one measured:
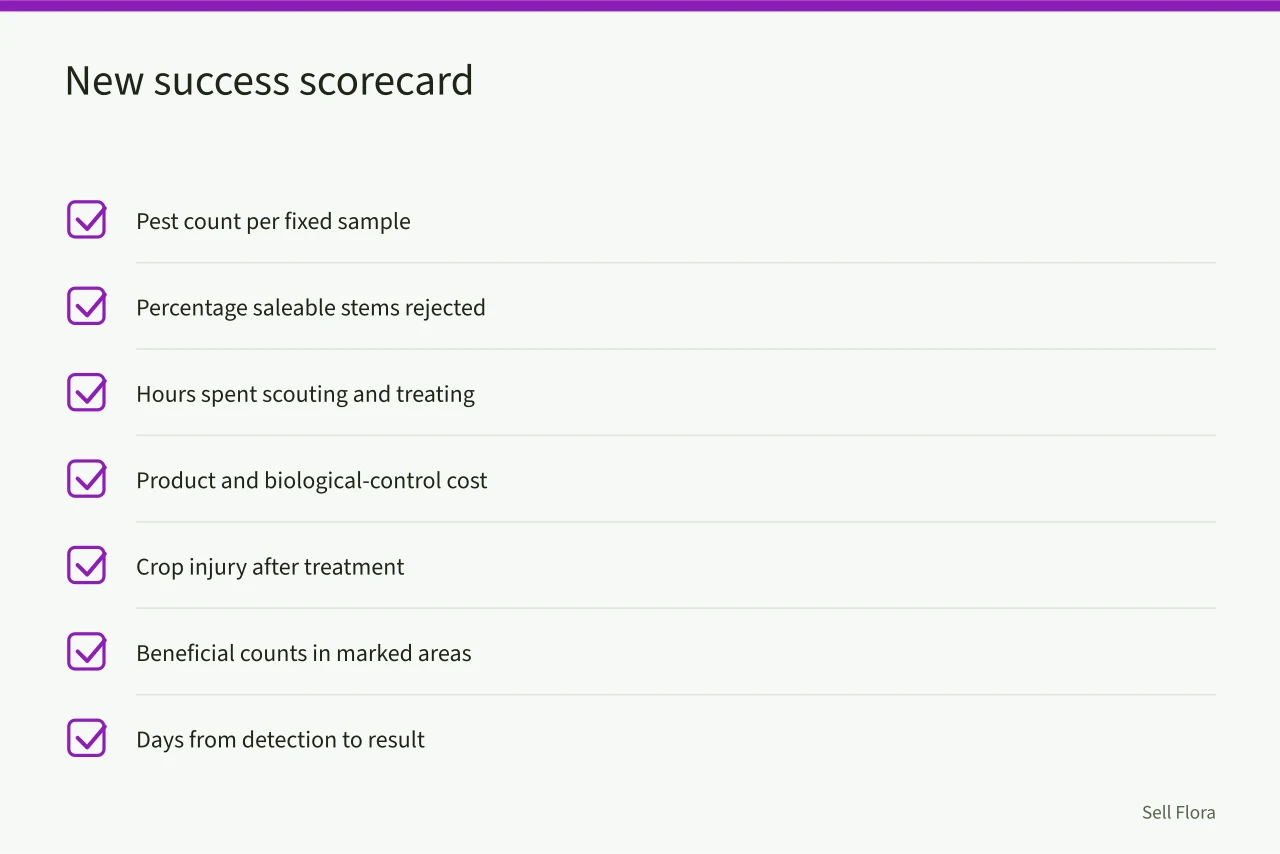
After eight weeks, thrips counts were lower and concentrated in fewer zones. Aphids stayed below the farm's provisional action point without a disruptive block treatment. The lisianthus issue stopped spreading after irrigation correction. Fewer applications were made, but the meaningful result was fewer rejected stems and better knowledge of why each action worked.
What the farm kept
North Lane retained twice-weekly checks for high-risk flowers, weekly full routes, incoming-stock isolation, fixed trap sites, diagnostic sampling rules, and follow-up dates assigned with every action. At season end, it reviewed which cultivars, suppliers, beds, and weather periods carried the most risk.
The farm did not eliminate pests. It replaced an unmeasured routine with evidence that could improve the next decision.
Common questions
Why did the farm pause calendar sprays?
It needed a baseline and had no evidence that nonessential scheduled applications matched current targets. Urgent, legally required, or confirmed controls would still proceed.
Why were predators counted?
Their presence changed the aphid decision and showed whether later actions disrupted biological control.
Did lower thrips counts prove resistance was absent?
No. Field performance can change because of coverage, timing, life stage, weather, identification, or resistance. The case corrected a documented reach problem.
Can another farm use North Lane's action point?
No. The number was provisional and specific to its crop, market, history, sampling method, and disease-vector risk.